Friday, March 13, 2015

History of Crayola Colors

Iron Viz entry #2

If you’ve been on Facebook recently, I’m sure you’ve witnessed the popularity of crayon art.  This is art created by melting crayons onto a canvas.  My younger sister joined the trend and has created some cool pieces of her own, showcased below:


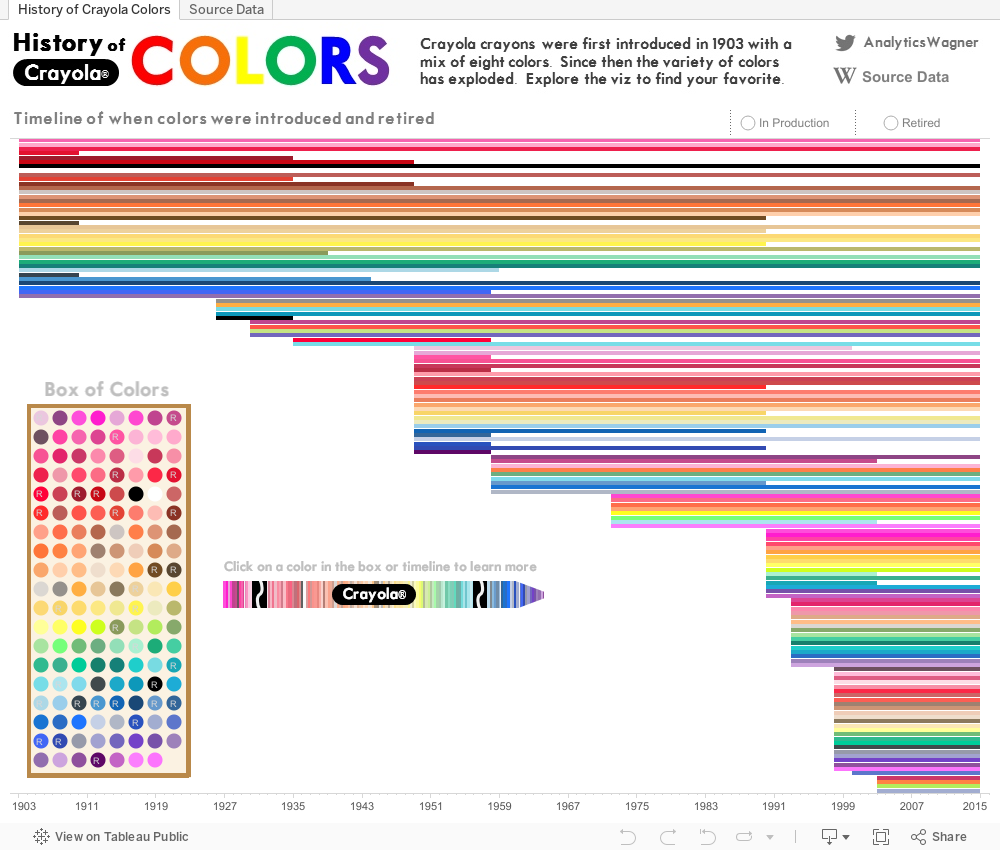
I found a List of Crayola crayon colors while looking through Wikipedia’s List of Lists of Lists.  The variety of colors that have been introduced over the years is incredible.  After seeing this, I knew that I had to build a viz with it.  What made it fun was that this data absolutely required the use of lots of colors – something that’s rarely recommended in dashboards.  Using crayon art as inspiration, I decided to focus this viz on the variety of colors that have been introduced and retired over the years.

This dashboard required a couple of unique techniques.  The first was building a custom color palette.  If you’re not familiar with custom palettes, Tableau provides a great article explaining how to Create Custom Color Palettes.  Since there were 151 colors, in order to make assigning them seamless, I sorted the colors alphabetically and then used Excel to create the XML tags around each color’s hex values before copy/pasting them into the Preferences.tps file.  Tip:  Excel makes a great companion when you’re creating really long calculations.  Now that I had my custom colors assigned, I wanted to find a way to sort it into a gradient of like colors.  What I found is that it’s pretty tough to sort hex colors into a rainbow-like gradient.  I did find a great article, Grouping Hex Colorsby Hue, detailing the best way to sort hex using HSL and HSV.  This method isn’t perfect but it does provide a good enough gradient that makes the color trends stand out better.  The other unique technique I used was for the crayon color change effect.  That was achieved through the use of a transparent image floated over a bar chart.  The crayon image was created in PowerPoint.

Enjoy the viz and make sure to click around to learn more about each color.


Wednesday, March 11, 2015

Ohh Charlie! A look at the most viewed YouTube videos

It’s that time of year again, the start of Iron Viz season.  The first of three feeders into the Iron Viz Championship is underway.  This first contest requires that you use data from Wikipedia.  Excited to enter, I scoured Wikipedia for a suitable dataset.  I knew I wanted to use a dataset that had broad appeal and had an aspect of virality to it.  My first idea was to build a viz about memes, specifically famous cats like Grumpy Cat, Lil Bub, and Nyan Cat.  Unfortunately, I wasn’t able to find a good ‘dataset’ to associate with them.  Sticking to the viral theme, I found a great list of the most viewed YouTube videos to use for my viz.

There has been a lot of press recently about Psy’s Gangnam Style video “breaking” YouTube’s view counter; it’s had over two billion views – the max 32-bit integer, which is what the counter is built on, is 2,147,483,647.  According to the Wikipedia source data, as of March 1st, 2015, Gangnam Style had 2,258,848,834 views.  This view count makes Gangnam Style an #outlier, with almost 2x the views of #2 Baby by Justin Bieber.  That could have been the focus of my viz but it feels like that story has played itself out.  Analyzing the dataset, there was something more interesting in the data that I wanted to focus my viz on.  It’s that Charlie Bit My Finger, which was uploaded almost eight years ago, is the 8th ranked video.  Also, it’s the only non-music video in the top twenty.  It’s pretty remarkable that the video has had such longevity and virality.  However, having seen the video, it’s not surprising that it’s #8. It has key ingredients which make it perfect for a viral hit:  a baby, it’s cute, and it’s short.  These things make Charlie Bit My Finger, the true #outlier out of the top twenty most viewed YouTube videos.

Explore the viz.  Click on a bar in the bar chart to view the video in the TV.  Tip:  IE/Chrome see the YouTube embed as an unsafe script, so you’ll need to either click the shield in the upper right (Chrome) or prompt at the bottom of the page (IE) in order to get the video to play (these show up after you click on the bar.)  Also, Vevo videos (which make up a majority of the list) won’t play when embedded.  The line chart at the bottom of the viz shows when a video was uploaded and the total number of views it had on March 1st, 2015.  It’s an attempt to show the avg. views per day and how fast a video reached the top twenty.


Friday, March 6, 2015

Tableau Desktop Certified Professional

Disclaimer:  This may be brag post

A goal I set for myself this year was to pass both the Tableau Desktop 8.0 Qualified Associate and Certified Professional exams. I’m happy to report that I've passed both of them!!  For those curious what each exam entails:

  Tableau Desktop Qualified Associate
  • Two hours
  • Multiple choice, response, and True/False questions
  • 30 knowledge based and 20 hands-on
  • Measures tool knowledge and usage
  Tableau Desktop Certified Professional
  • Three hours
  • Hands on building and analyzing dashboards
  • Measures understanding of dashboard and data visualization best practices
A preparation guide can be downloaded for each of the tests.  I highly recommend using them as your study guide; if you do, you shouldn't have a problem passing both exams.  As a self-taught Tableau user, the hardest part of the Qualified Associate exam was knowing the vocabulary.  Otherwise, with a few years of experience, the test was relatively easy.  The Certified Professional exam was another story.  It was a very intense three hours of frantic typing and viz building (tip – don’t drink any liquids during the exam, you’ll regret it after three hours!)  The exam provided a very unique situation that differs from the expectations of most people’s day jobs.  You’re rarely expected to create multiple full-featured dashboards in under two hours.  There are also multiple questions where you critique views and explain what’s good/bad about them and what you’d change.  The difficult aspect of those questions is getting a sense of how detailed you should be.  

Please post in the comments section if you’d like any advice on preparing for the exams.

Tableau Desktop 8 Certified Professional logo


Sunday, January 25, 2015